Why Market Cap Changes How You Read Commodities
Most charting platforms show commodities as a price line and stop there. Price tells you what one ounce of gold or one bushel of wheat costs today, but it says nothing about how large that market actually is compared with another. TradingView, for instance, will happily plot gold and crude oil side by side, but it has no concept of the total value each market represents — you're left eyeballing two unrelated price scales.
OmniaChart computes an estimated market capitalization for every commodity — price multiplied by the best available estimate of global supply — so wildly different commodities land on a comparable scale. In the table below, gold's market cap ($28.15T) is larger than crude oil's ($465.68B) by a factor of roughly 60, even though oil trades far higher daily volumes. That is a market-size comparison a price-only chart cannot make. It's the same market-cap lens OmniaChart already applies across crypto sectors and collectibles, extended here to commodities.
All 36 Commodities Tracked by OmniaChart, Ranked by Market Cap
The table below is generated from OmniaChart's public commodities data, sorted by estimated market capitalization — largest first. Gold and silver (marked FREE) are chartable at no cost and without an account; the rest are available on the Pro and Whale plans.
| Commodity | Category | Price | Market Cap | 1M Change | Updated |
|---|---|---|---|---|---|
| Gold FREEXAU | Precious Metals | $4,049.10 | $28.15T | -0.47% | Jul 31, 2026 |
| SteelSTEEL | Base Metals | $925.92 | $23.79T | +0.22% | Dec 31, 2010 |
| CopperXCU | Base Metals | $6.44 | $10.64T | +5.10% | Jul 31, 2026 |
| Silver FREEXAG | Precious Metals | $57.59 | $3.24T | -4.15% | Jul 31, 2026 |
| Live CattleCATTLE | Agriculture | $231.75 | $2.11T | -4.17% | Jul 31, 2026 |
| GraphiteGRAPHITE | Battery Metals | $2,083.02 | $687.40B | 0.00% | Feb 25, 2026 |
| UraniumURANIUM | Energy | $55.88 | $649.94B | +7.96% | Feb 25, 2026 |
| Crude Oil (WTI)USOIL | Energy | $84.67 | $465.68B | +23.46% | Jul 31, 2026 |
| PlatinumXPT | Precious Metals | $1,650.30 | $412.67B | +3.86% | Jul 31, 2026 |
| NiobiumNIOBIUM | Base Metals | $18,700.00 | $230.01B | +0.20% | Dec 31, 2000 |
| PalladiumXPD | Precious Metals | $1,275.60 | $223.23B | +5.18% | Jul 31, 2026 |
| LumberLUMBER | Agriculture | $614.00 | $130.11B | -0.89% | Jul 31, 2026 |
| CoalCOAL | Energy | $96.00 | $124.80B | -0.16% | Dec 26, 2025 |
| ApplesAPPLE | Fruits | $771.74 | $74.86B | 0.00% | Mar 11, 2026 |
| WheatWHEAT | Agriculture | $639.25 | $62.02B | +7.98% | Jul 31, 2026 |
| GrapesGRAPE | Fruits | $711.98 | $55.53B | 0.00% | Mar 11, 2026 |
| SoybeansSOYBEAN | Agriculture | $1,172.00 | $53.59B | +4.06% | Jul 31, 2026 |
| RiceRICE | Agriculture | $13.96 | $52.27B | +8.51% | Jul 31, 2026 |
| CornCORN | Agriculture | $440.75 | $50.78B | +4.69% | Jul 31, 2026 |
| OrangesORANGE | Fruits | $499.92 | $38.49B | 0.00% | Mar 12, 2026 |
| CottonCOTTON | Agriculture | $80.50 | $28.87B | +9.85% | Jul 31, 2026 |
| CocoaCOCOA | Agriculture | $5,397.00 | $24.29B | +7.81% | Jul 31, 2026 |
| Natural GasNGAS | Energy | $2.75 | $23.35B | -14.69% | Jul 31, 2026 |
| CherriesCHERRY | Fruits | $4,873.41 | $22.91B | 0.00% | Mar 11, 2026 |
| SugarSUGAR | Agriculture | $14.66 | $16.39B | -2.20% | Jul 31, 2026 |
| LemonsLEMON | Fruits | $749.92 | $16.12B | 0.00% | Mar 12, 2026 |
| AvocadosAVOCADO | Fruits | $1,587.51 | $15.88B | 0.00% | Mar 11, 2026 |
| StrawberriesSTRAWBERRY | Fruits | $1,424.22 | $14.24B | 0.00% | Mar 11, 2026 |
| PeachesPEACH | Fruits | $552.01 | $13.80B | 0.00% | Mar 11, 2026 |
| CoffeeCOFFEE | Agriculture | $332.10 | $13.17B | +2.41% | Jul 31, 2026 |
| PearsPEARS | Fruits | $461.33 | $12.46B | 0.00% | Mar 11, 2026 |
| GrapefruitsGRAPEFRUIT | Fruits | $599.98 | $6.00B | 0.00% | Mar 12, 2026 |
| Orange Juice (FCOJ)OJ | Fruits | $3,416.06 | $5.47B | -11.41% | Jul 31, 2026 |
| BlueberriesBLUEBERRY | Fruits | $2,463.89 | $3.20B | 0.00% | Mar 11, 2026 |
| RaspberriesRASPBERRY | Fruits | $2,708.07 | $2.71B | 0.00% | Mar 11, 2026 |
| LithiumLITHIUM | Battery Metals | $69.22 | $1.94B | -11.22% | Jul 31, 2026 |
Data as of the dates shown in the "Updated" column, pulled from OmniaChart's public commodities API on August 2, 2026. This is a static snapshot for reference — it is not a live feed. Update frequency varies by commodity: gold, silver, copper, live cattle and the major agricultural futures refresh daily; fruit, battery metals and some energy commodities (uranium, coal) update on a much slower cycle — each row carries its own date, and some are years old; fruit and battery-metal categories update on a slower cycle (as shown above); Niobium and Steel reflect the most recent production-based estimate available and are not daily-traded futures. Open any commodity in the app for its full, continuously updated chart.
Example: Silver vs Gold, by Market Cap
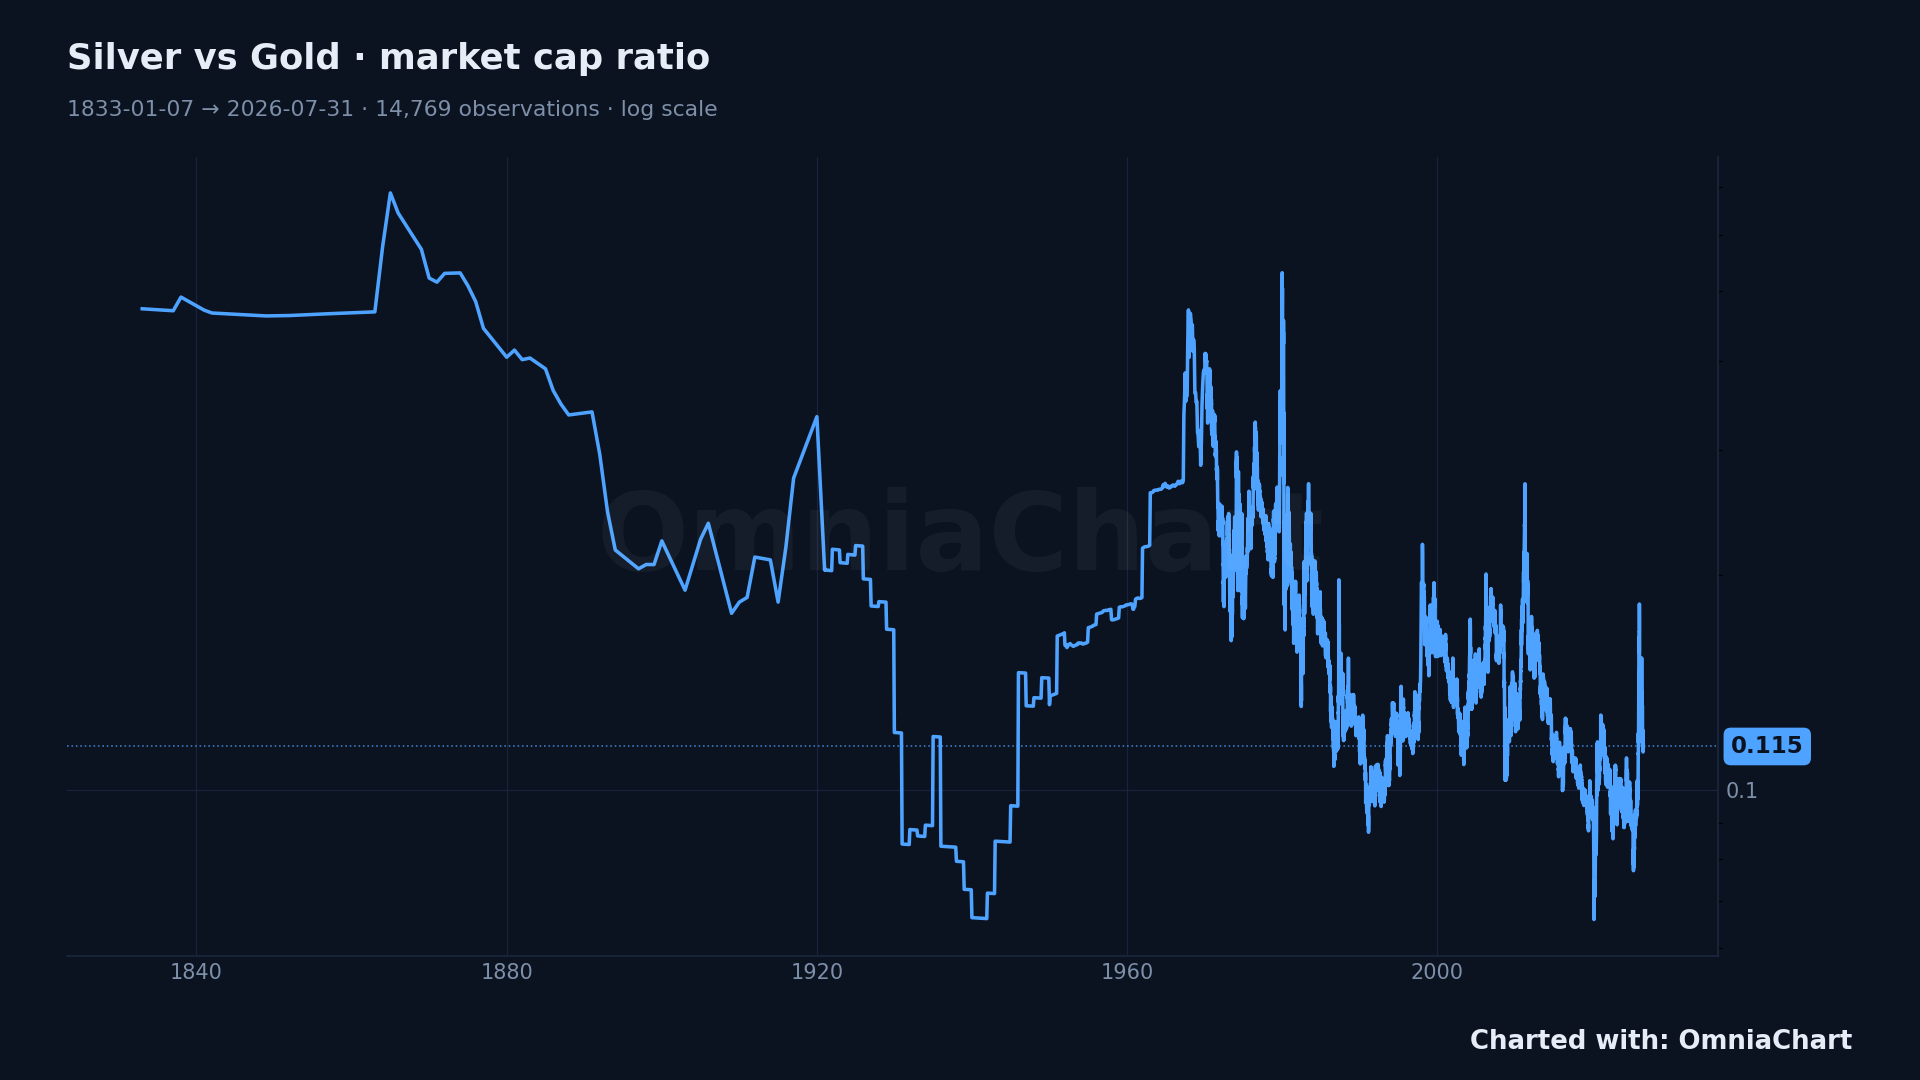
Most sites quote the Gold/Silver ratio in price terms — how many ounces of silver it takes to buy one ounce of gold. At the prices in the table above that's about 70:1 ($4,049.10 ÷ $57.59). But price-per-ounce ignores how much of each metal actually exists. By market cap, Gold's $28.15T is about 8.7 times Silver's $3.24T — a very different number, because a lot more silver has been mined and is in circulation relative to its price than gold. That gap between the price ratio and the market-cap ratio is exactly the kind of thing a supply-blind chart hides. The chart above plots that market-cap ratio back to 1833, free to open at the link in the caption — no account needed.
Compare Commodities Across Asset Classes
Commodities don't move in isolation — gold reacts to real interest rates and the dollar, oil reacts to growth expectations, and both increasingly get compared to Bitcoin as a "hard asset" narrative. OmniaChart's ratio engine lets you build any of those comparisons directly: Gold vs Bitcoin, Oil vs the S&P 500, Copper vs the dollar index, or a custom ratio between any two of the 36 commodities above. Instead of eyeballing two separate charts with different scales, you get one line that goes up when the numerator outperforms and down when it doesn't.
For gold and silver specifically, OmniaChart's price history runs back to 1300 AD — centuries deeper than typical retail data providers — which is why the ratio chart above can start in 1833 instead of the last few decades. That depth matters for putting a "multi-decade low" or "all-time high" headline in real historical context instead of taking it at face value.
- Gold vs Bitcoin: compare the oldest store of value against the newest one
- Platinum vs Gold: a live preview chart on OmniaChart — try it free
- Silver vs Gold: the market-cap ratio charted above, free with no account
- Any commodity vs the S&P 500 or the dollar index: available on Pro and Whale plans
The same market-cap engine that powers these commodity ratios also drives OmniaChart's crypto sector indexes and collectible market caps, so the workflow is identical whether you're comparing gold to silver or Bitcoin to Pokemon cards.
Frequently Asked Questions
Is there a free commodity charting tool?
Yes. OmniaChart offers free, real-time charting for gold (XAU) and silver (XAG) with no signup required — full price history, log-scale charts, and basic drawing tools. The other 34 commodities on this page, plus custom cross-asset ratios, are available on the Pro and Whale plans.
Can I chart gold against Bitcoin or stocks?
Yes. OmniaChart's ratio engine lets you divide any asset by any other, so you can chart Gold/Bitcoin, Gold/S&P 500, or Silver/Gold as a single line. This shows relative value over time instead of two separate price charts you have to compare mentally.
How do I compare commodity prices historically?
Switch a commodity chart to market cap mode instead of price. Market cap accounts for how much of a commodity exists, so it lets you compare very different commodities — like gold and crude oil — on the same scale, something a price-only chart cannot do. For gold and silver, OmniaChart's history goes back centuries.
How many commodities does OmniaChart track?
36 commodities across six categories: precious metals (gold, silver, platinum, palladium), energy (crude oil, natural gas, uranium, coal), base metals (copper, steel, niobium), agriculture (wheat, corn, soybeans, cotton, cocoa, coffee, sugar, rice), battery metals (lithium, graphite), and fruits (apples, oranges, cherries, and more).
Can I compare two commodities directly, like silver vs gold?
Yes. The Silver/Gold market cap ratio is a free chart on OmniaChart — no account needed. It shows how silver's total market value moves relative to gold's, which is a different (and often more useful) signal than the commonly quoted price ratio.