Every figure on this page was recomputed from the series as it stood on 2026-08-07, the date of its most recent observation.
The short answer
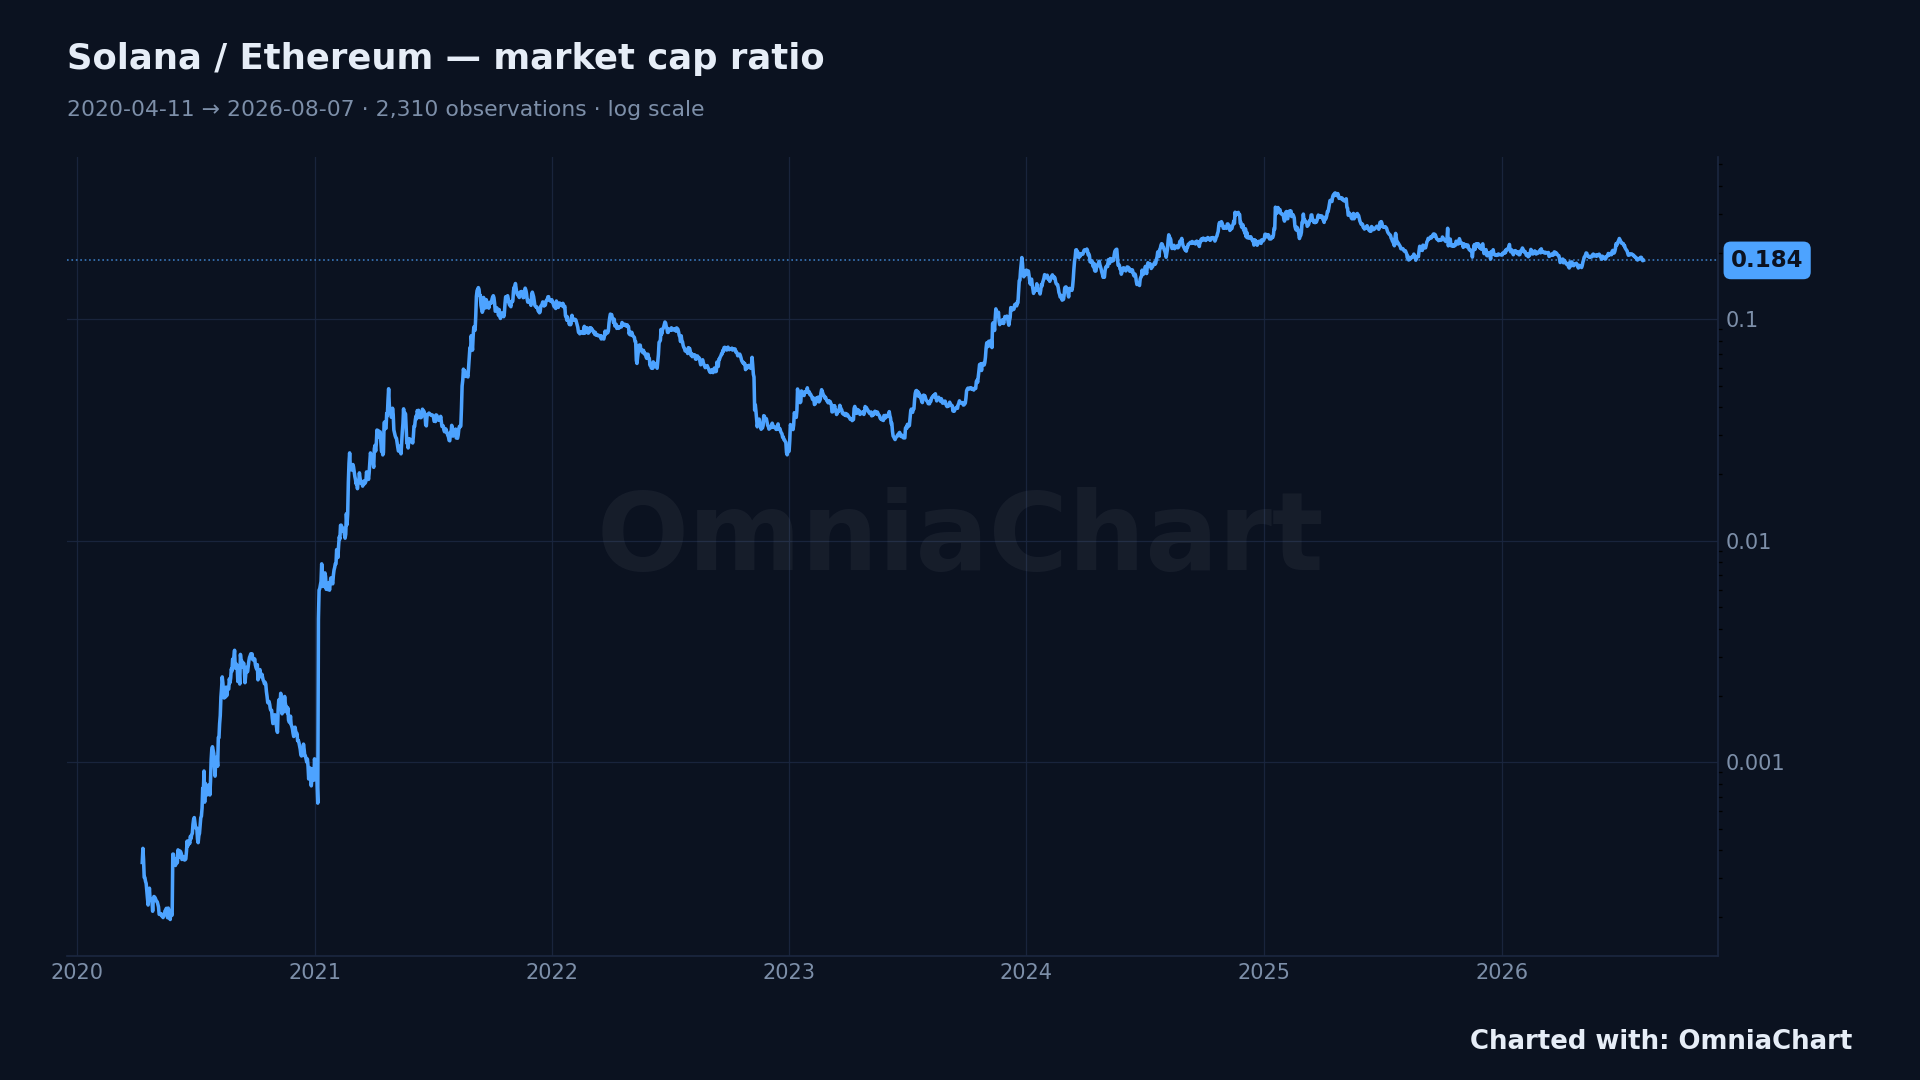
On 2026-08-07 Solana's market capitalization was 0.184 times Ethereum's.
That is the 67th percentile of the 2,310 observations recorded since 2020-04-11.
The record high is 0.372 on 2025-04-20; over the 28 days since 2026-07-10 the ratio moved -12.1%.
How to read this chart
Solana and Ethereum have very different supply schedules, so their coin prices are not comparable and the price ratio drifts with issuance. Dividing market cap by market cap gives the share of Ethereum's total value that Solana currently carries. On a log scale, equal vertical distances mean equal percentage moves, which is what makes a multi-year ratio readable at all.
Method and data
The chart and the three figures above are recomputed from OmniaChart's production data API, not copied from an earlier version of this page. The series is Solana's market capitalization divided by Ethereum's market capitalization, built as one point per date the two sides share, which is why the observation count (2,310) is smaller than the calendar span. Coverage runs 2020-04-11 to 2026-08-07 — 6.3 years. The vertical axis is logarithmic, so equal distances are equal percentage moves. The window opens when Solana began trading, for the same reason.
If the underlying series stops updating, this page is not regenerated with old numbers: the generator refuses to write it. A dated figure is the only kind worth publishing.
Frequently asked questions
What does the SOL/ETH ratio measure?
The fraction of Ethereum's total market value that Solana represents on a given day. A value of 0.20 means Solana is worth one fifth of Ethereum.
Why a log scale?
Because the ratio spans orders of magnitude over its history. On a linear axis the early years would be flattened into the baseline and the chart would only show the last cycle.
Is this chart free?
Yes, SOL/ETH is one of the free cross-asset ratios in OmniaChart.