Every figure on this page was recomputed from the series as it stood on 2026-08-07, the date of its most recent observation.
The short answer
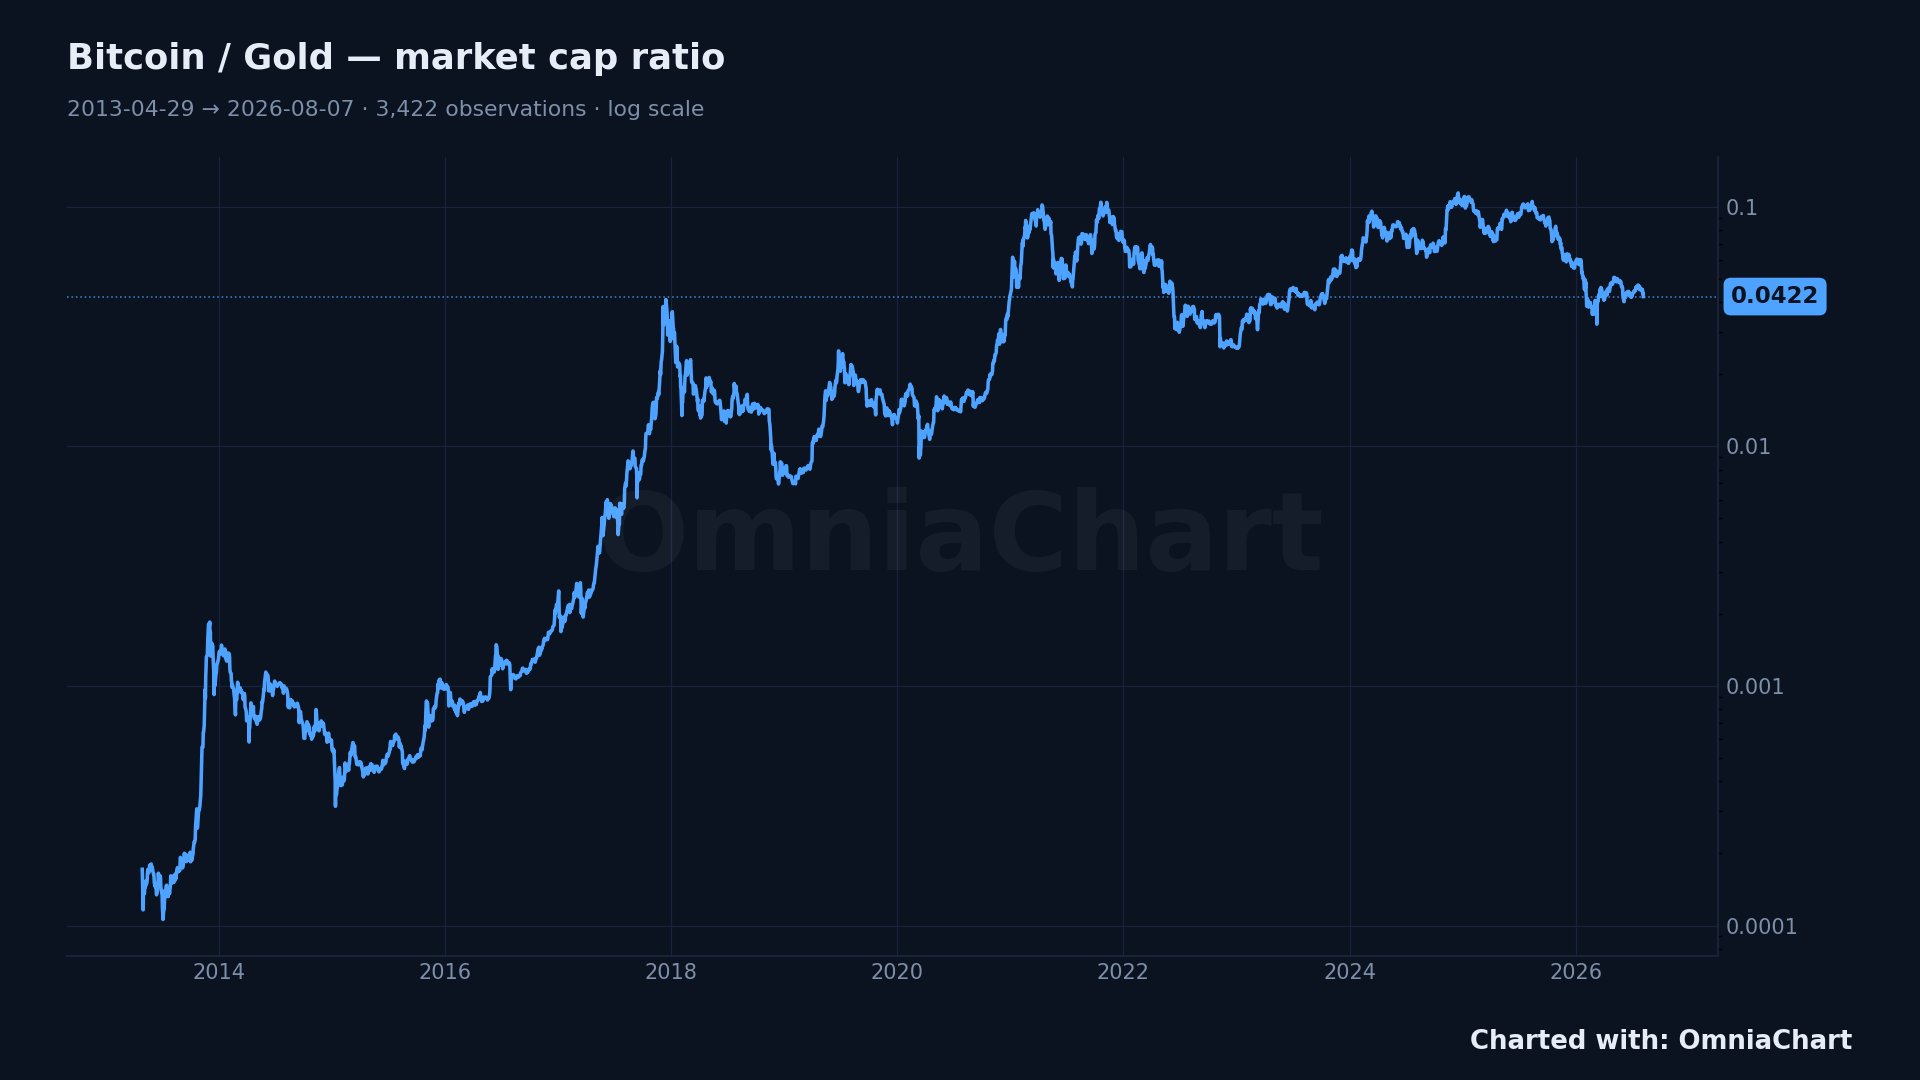
On 2026-08-07, Bitcoin's market capitalization was 0.0422 times gold's — gold is still the larger of the two.
That reading sits at the 67th percentile of the 3,422 observations recorded since 2013-04-29: the ratio has been lower than this on about 67% of them.
The highest reading in that record is 0.114, set on 2024-12-17; over the 28 days since 2026-07-10 the ratio moved -5.7%.
How to read this chart
The line is one number: Bitcoin's market cap divided by gold's. A value of 0.05 means Bitcoin is worth one twentieth of gold; a value above 1 would mean Bitcoin had passed it. Because both legs are market caps and not prices, the comparison already accounts for how much of each asset exists — the reason a $4,000 ounce of gold and a $100,000 bitcoin can sit on the same line at all.
Method and data
The chart and the three figures above are recomputed from OmniaChart's production data API, not copied from an earlier version of this page. The series is Bitcoin's market capitalization divided by gold's market capitalization, built as one point per date the two sides share, which is why the observation count (3,422) is smaller than the calendar span. Coverage runs 2013-04-29 to 2026-08-07 — 13.3 years. The vertical axis is logarithmic, so equal distances are equal percentage moves. The window opens on the first day of continuous Bitcoin market-cap data. OmniaChart also carries a reconstructed series back to 2009, when Bitcoin had no market; it is excluded here because a ratio against a market that does not exist yet is not a comparison.
If the underlying series stops updating, this page is not regenerated with old numbers: the generator refuses to write it. A dated figure is the only kind worth publishing.
Frequently asked questions
Is Bitcoin's market cap bigger than gold's?
Not yet. The ratio on this page is below 1, which means gold's total market value is still larger. The chart shows the whole history of that gap rather than a single snapshot.
Where does this data come from?
Gold's market cap is its price multiplied by the best available estimate of above-ground supply; Bitcoin's is price multiplied by circulating supply. Both series come from OmniaChart's public data API and the chart above is regenerated from it, with the observation date printed on the page.
Can I chart this ratio myself?
Yes, and without an account: BTC/XAU is one of the free cross-asset ratios in OmniaChart. Opening it gives you the live version of the chart above, with zoom, log scale and drawing tools.