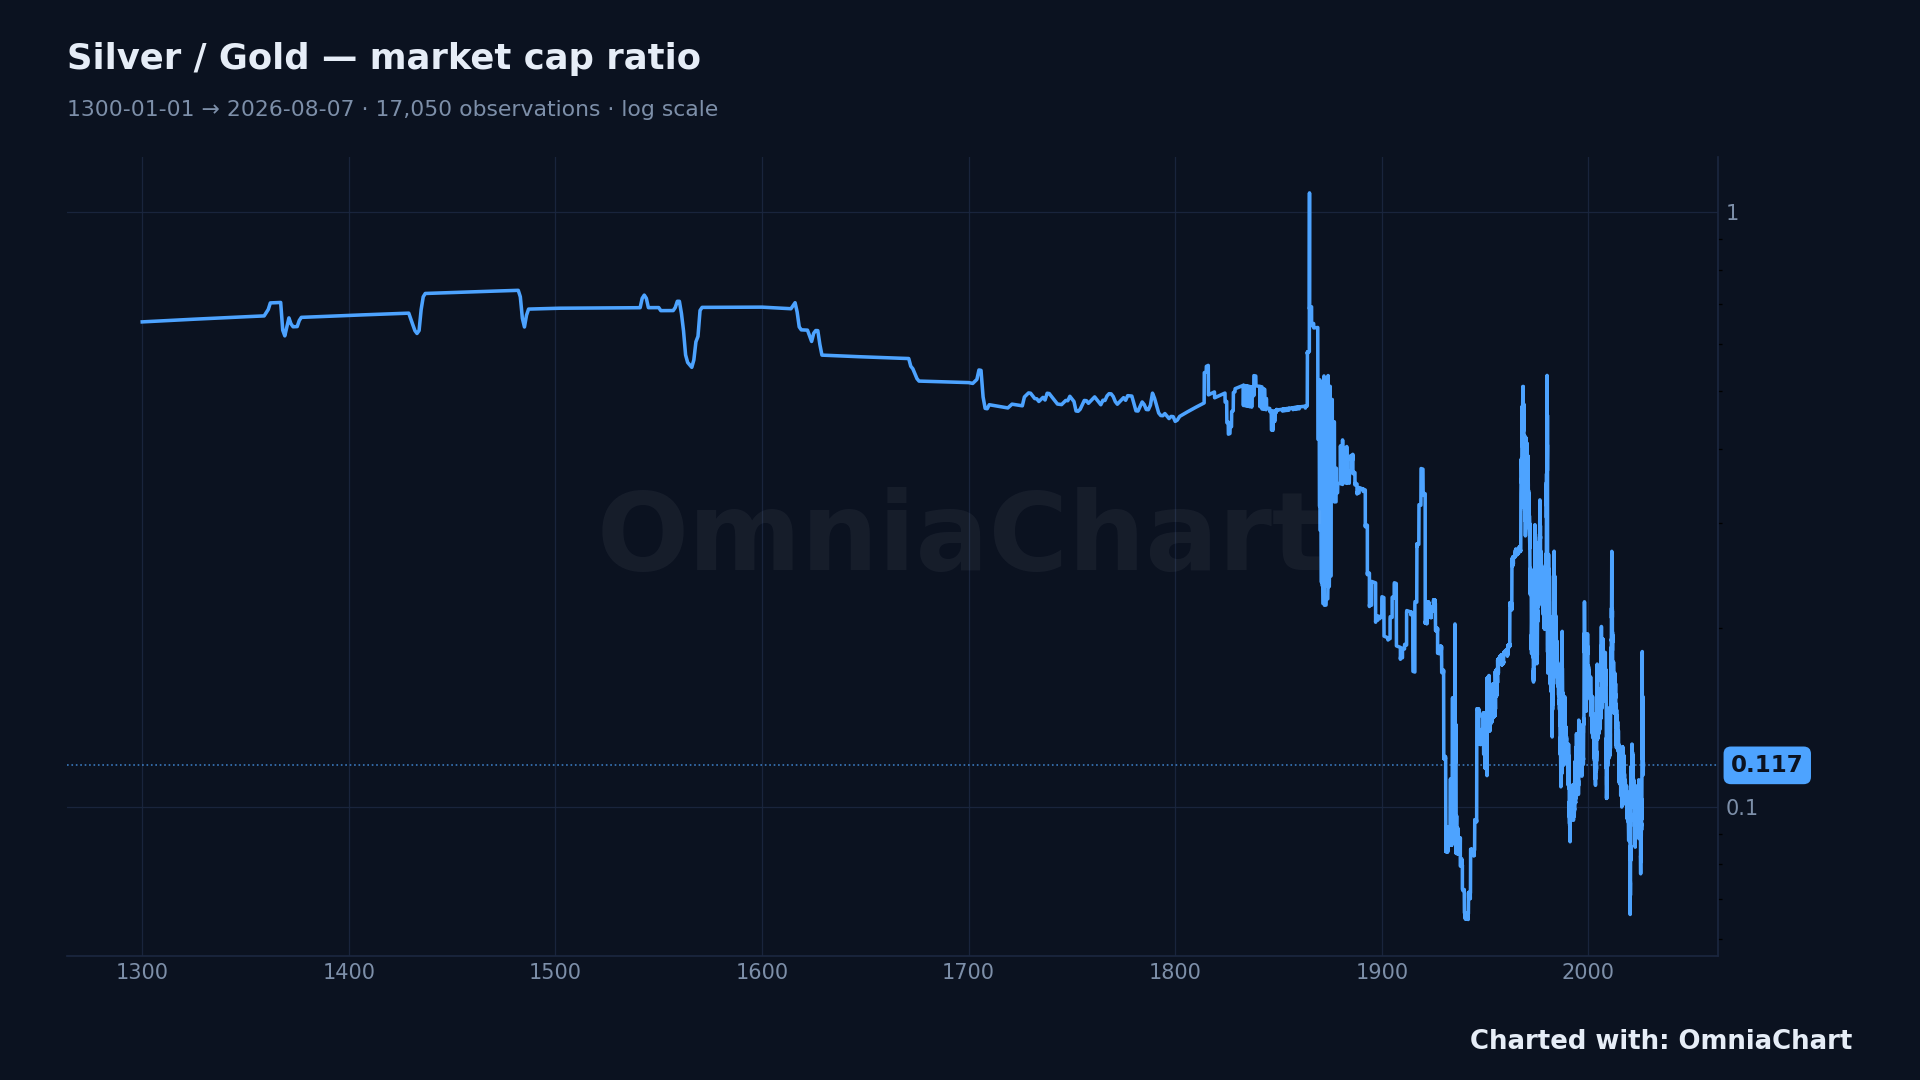
Every figure on this page was recomputed from the series as it stood on 2026-08-07, the date of its most recent observation.
The short answer
On 2026-08-07 the silver market was worth 0.117 times the gold market.
That is the 24th percentile of the 17,050 observations recorded since 1300-01-01.
The high of the record is 1.08 on 1865-01-01; over the 28 days since 2026-07-10 the ratio moved -0.7%.
How to read this chart
The familiar gold/silver ratio divides one ounce price by the other and lands around double digits. This chart divides total market value by total market value, and lands much lower, because far more silver has been mined than gold but each ounce is worth far less. The two ratios answer different questions: the price ratio asks how many ounces of silver buy an ounce of gold, this one asks how large the silver market is next to the gold market.
Method and data
The chart and the three figures above are recomputed from OmniaChart's production data API, not copied from an earlier version of this page. The series is silver's market capitalization divided by gold's market capitalization, built as one point per date the two sides share, which is why the observation count (17,050) is smaller than the calendar span. Coverage runs 1300-01-01 to 2026-08-07 — 726.6 years. The vertical axis is logarithmic, so equal distances are equal percentage moves. The window is the full recorded series for both metals, which is why it starts centuries before either had a daily quote: the early points are annual and the later ones daily. That is also why the observation count is far smaller than the number of days in the span.
If the underlying series stops updating, this page is not regenerated with old numbers: the generator refuses to write it. A dated figure is the only kind worth publishing.
Frequently asked questions
How is this different from the gold/silver ratio?
The classic ratio is a price ratio between two ounces. This one is a market-size ratio between two above-ground stocks, so it embeds how much of each metal exists.
Where does the supply estimate come from?
Above-ground supply estimates for both metals, applied consistently across the whole series. The estimate is the weakest link in any commodity market cap, which is why the method is stated rather than hidden.
Are gold and silver free on OmniaChart?
Yes. Gold and silver are free forever, individually and as the XAG/XAU ratio, with no account required.