Every figure on this page was recomputed from the series as it stood on 2026-08-07, the date of its most recent observation.
The short answer
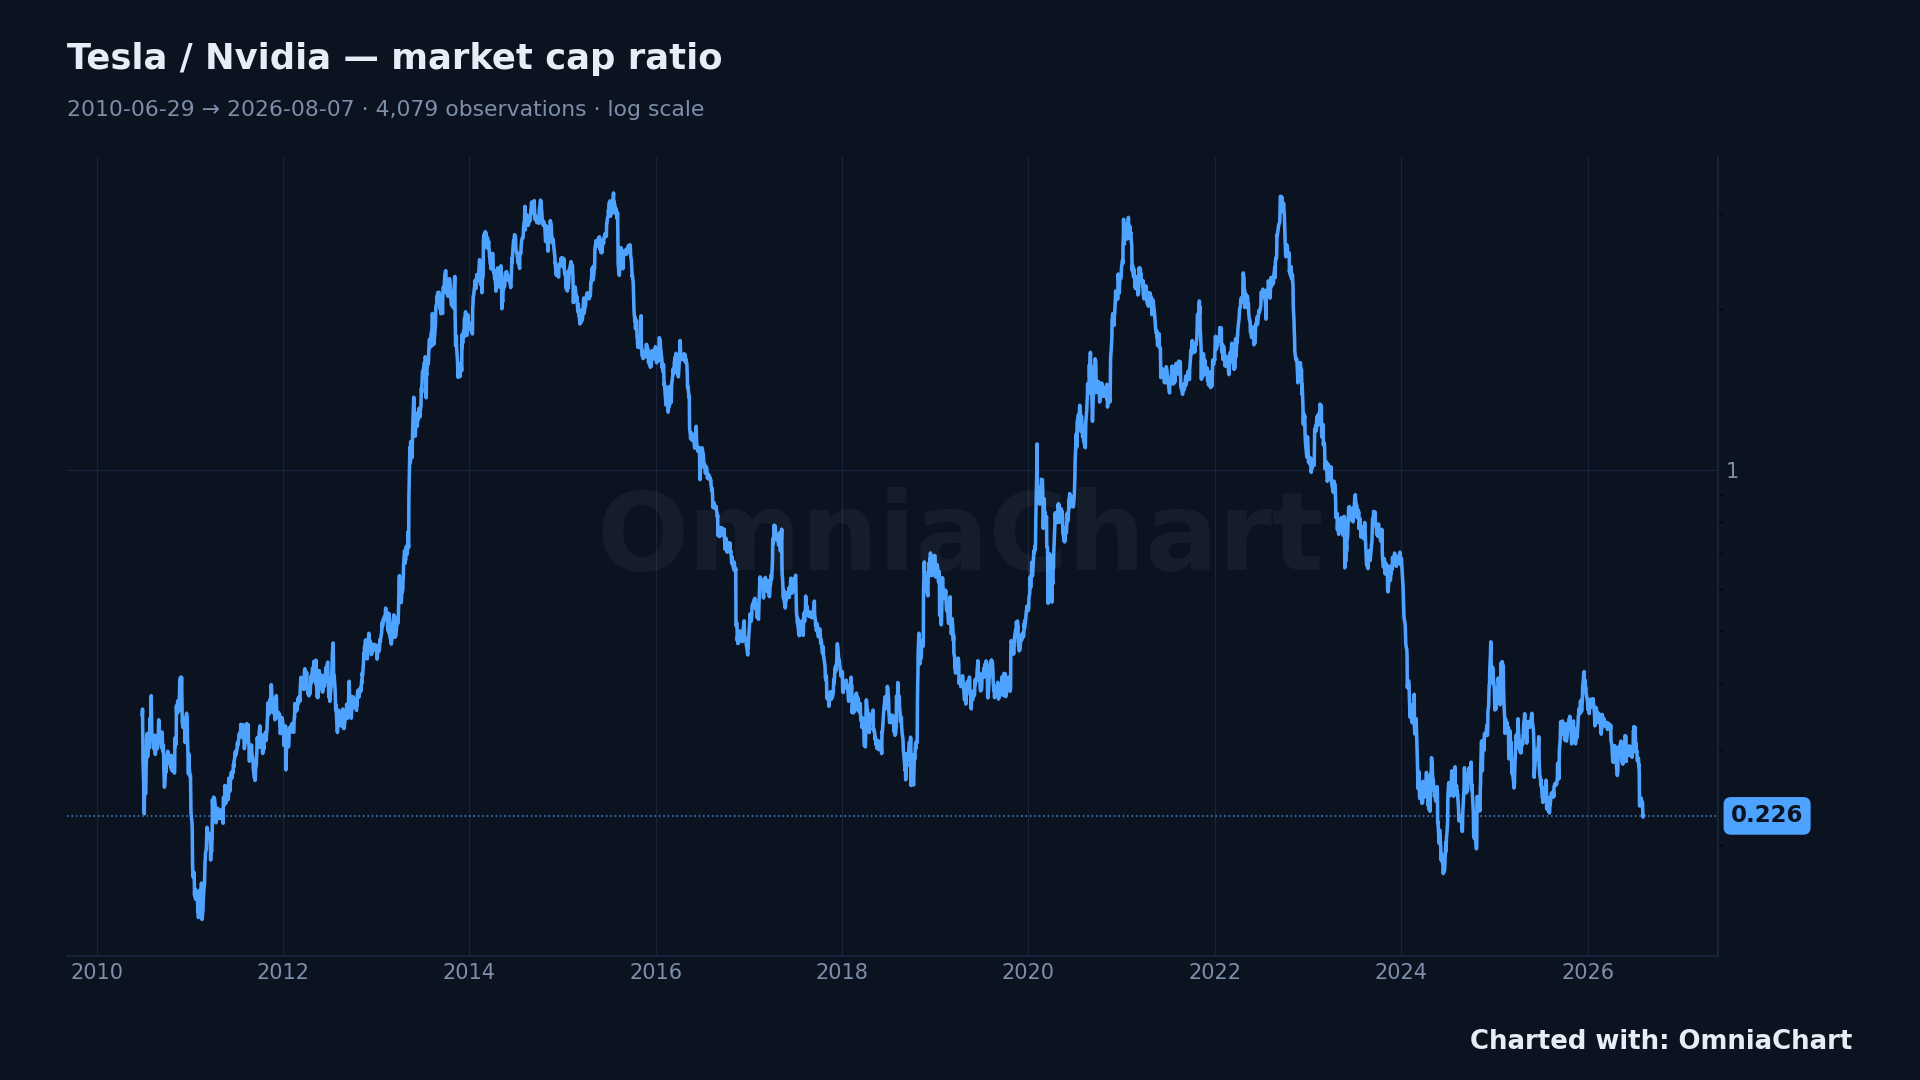
On 2026-08-07 Tesla was worth 0.226 times Nvidia by market capitalization.
That is the 3rd percentile of the 4,079 observations recorded since 2010-06-29 — Tesla has been relatively cheaper than this on about 3% of them.
The peak of the record is 3.29 on 2015-07-20; over the 28 days since 2026-07-10 the ratio moved -24.1%.
How to read this chart
Share prices cannot be compared across two companies, because a share is an arbitrary slice: a $400 stock is not more expensive than a $180 one. Market capitalization removes the slicing, and the ratio removes the second axis. When the line falls, Nvidia is gaining on Tesla regardless of whether both stocks went up that week.
Method and data
The chart and the three figures above are recomputed from OmniaChart's production data API, not copied from an earlier version of this page. The series is Tesla's market capitalization divided by Nvidia's market capitalization, built as one point per date the two sides share, which is why the observation count (4,079) is smaller than the calendar span. Coverage runs 2010-06-29 to 2026-08-07 — 16.1 years. The vertical axis is logarithmic, so equal distances are equal percentage moves. The window opens on Tesla's first trading day. OmniaChart carries pre-IPO valuations for Tesla as a separate series, and they are excluded here so that both sides of the ratio are listed companies throughout.
If the underlying series stops updating, this page is not regenerated with old numbers: the generator refuses to write it. A dated figure is the only kind worth publishing.
Frequently asked questions
Why compare market caps instead of share prices?
Because share count differs. Two companies of identical value can quote prices an order of magnitude apart. Market cap is price multiplied by shares outstanding, which is the comparable quantity.
Does the chart adjust for splits?
The market cap series is built from price and shares outstanding, so a split, which changes both in opposite directions, leaves the market cap line continuous.
Is the Tesla/Nvidia chart free?
Yes. TSLA/NVDA is one of the free cross-asset ratios and opens in OmniaChart without an account.